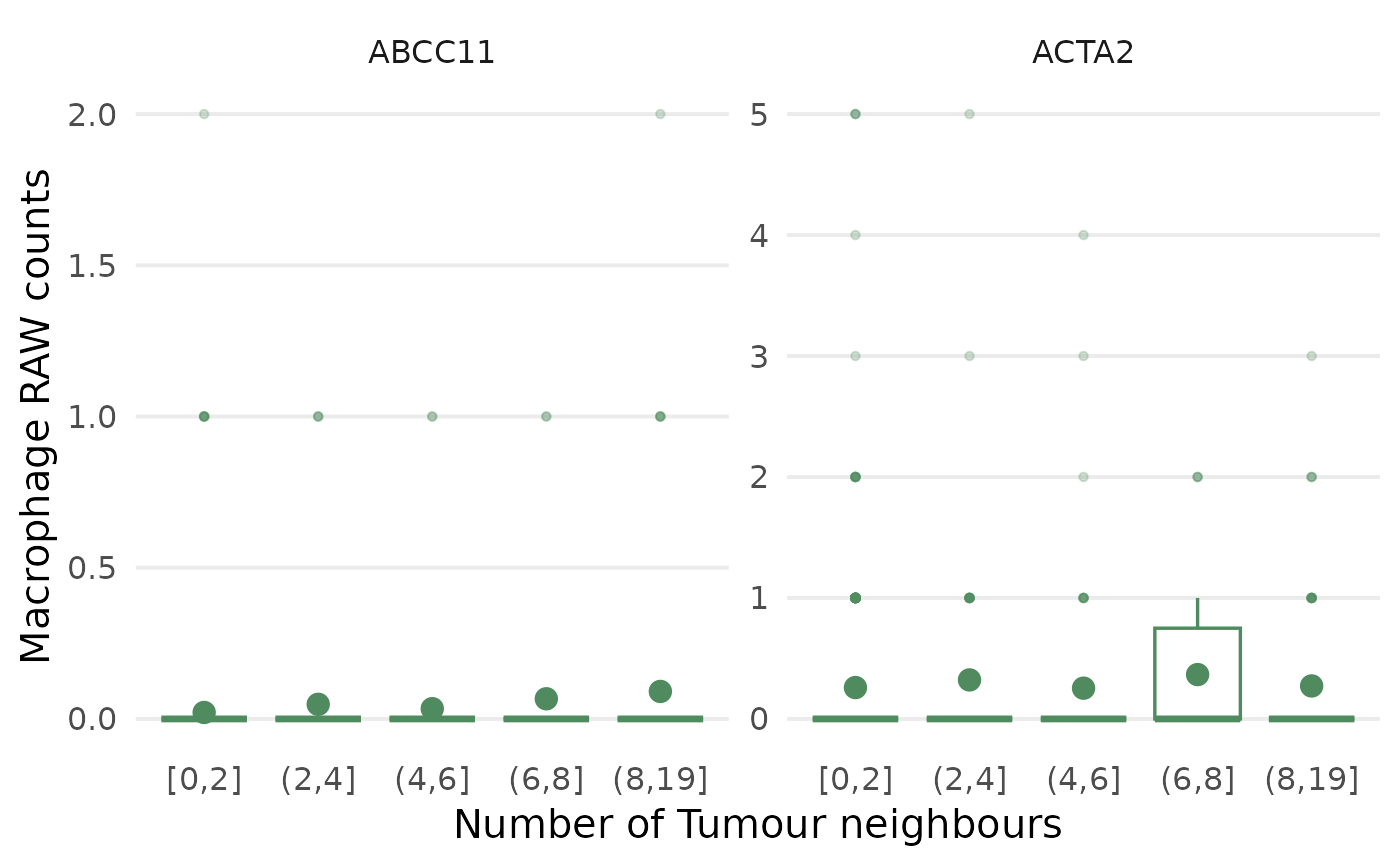
Reproduces the manuscript proximity figure (verbatim style port of
density_bin_boxplot in the analysis helpers): for each focal cell the number
of neighbour-type cells within radius micrometres is counted and binned,
and each gene's raw counts are drawn as a boxplot per bin with the per-bin mean
overlaid as a point. Because these genes are zero-inflated the box median sits
at zero in most bins, so the mean point carries the trend.
Arguments
- object
A PACEFit (supplies the cell-type column used at fit time).
- spe
The SpatialExperiment::SpatialExperiment that was fitted.
- genes
Character vector of genes (shown as facets).
- focal, neighbour
Focal and neighbour cell types.
- radius
Neighbour search radius in micrometres (default 30).
- breaks
Neighbour-count bin breaks (default
c(0, 2, 4, 6, 8, Inf)).- condition
Optional
colDatacolumn splitting the boxes by group, so the two arms of a condition cohort can be compared within each bin.TRUEuses the fit's owncondition_col;NULL(default) pools all cells.- condition_colours
Colours for the condition levels.
- box_colour
Box and mean-point colour, used when
conditionisNULL.- assay_name
Counts assay name (default
"counts").
Examples
spe <- readRDS(system.file("extdata", "bc_xenium_subset.rds", package = "PACE"))
fit <- readRDS(system.file("extdata", "pace_fit_example.rds", package = "PACE"))
g <- head(subset(neighbourSlopes(fit),
                  focal == "Macrophage" & neighbour == "Tumour")$gene, 2)
plotProximity(fit, spe, g, "Macrophage", "Tumour")