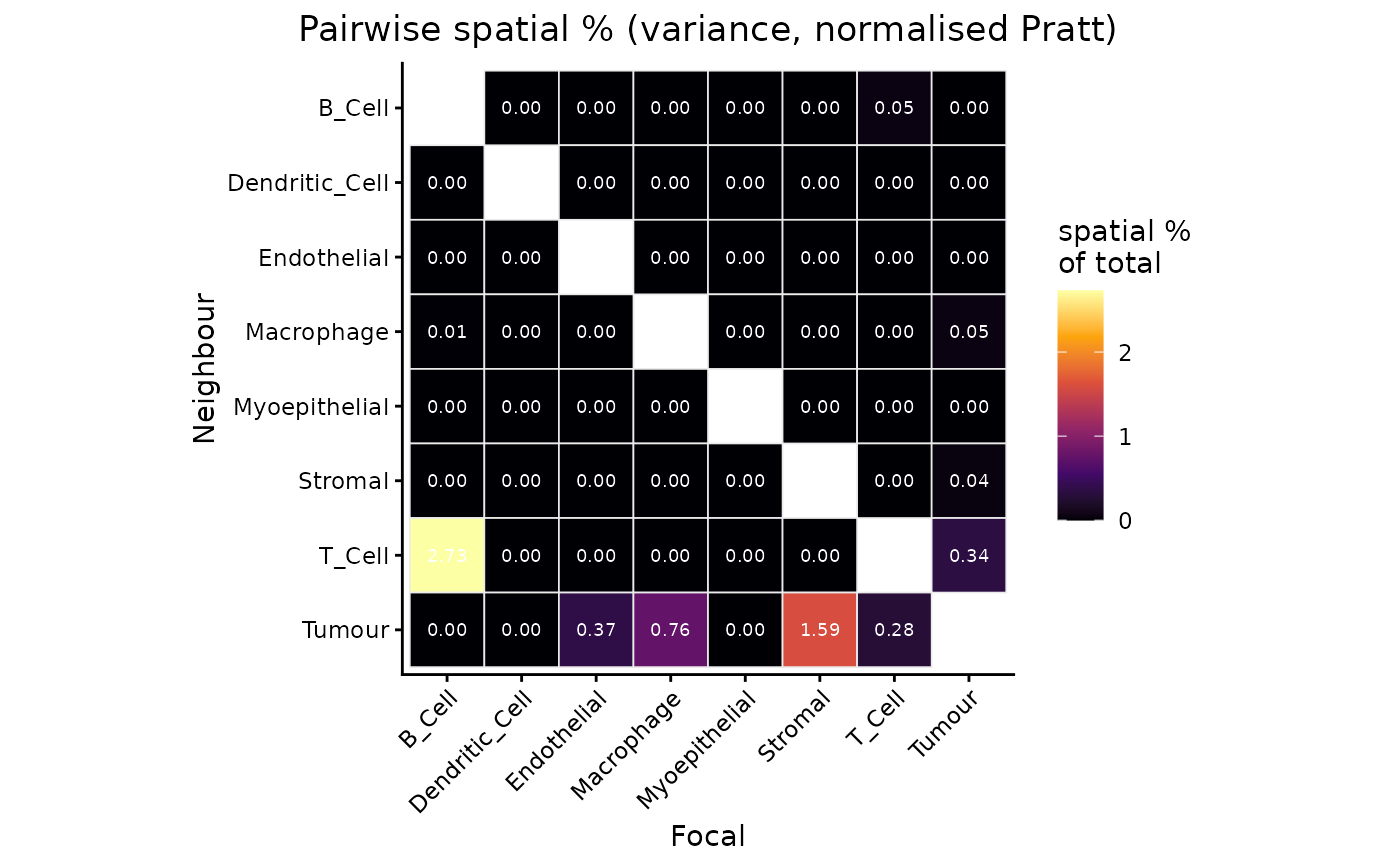
Reproduces the manuscript pairwise heatmap: each cell is the percentage of the focal type's total variance contributed by spatial interaction with that neighbour, computed as the focal's spatial share split across neighbours by the off-diagonal-renormalised Pratt attribution.
Usage
plotPairHeatmap(object, block = c("spatial", "responder"), title = NULL)Arguments
- object
A PACEFit.
- block
Which spatial block to map:
"spatial"(default, the baseline spatial cell state) or"responder"(the responder-by-proximity block, for condition cohorts).- title
Plot title; a sensible default is chosen per
block.
Examples
fit <- readRDS(system.file("extdata", "pace_fit_example.rds", package = "PACE"))
plotPairHeatmap(fit)