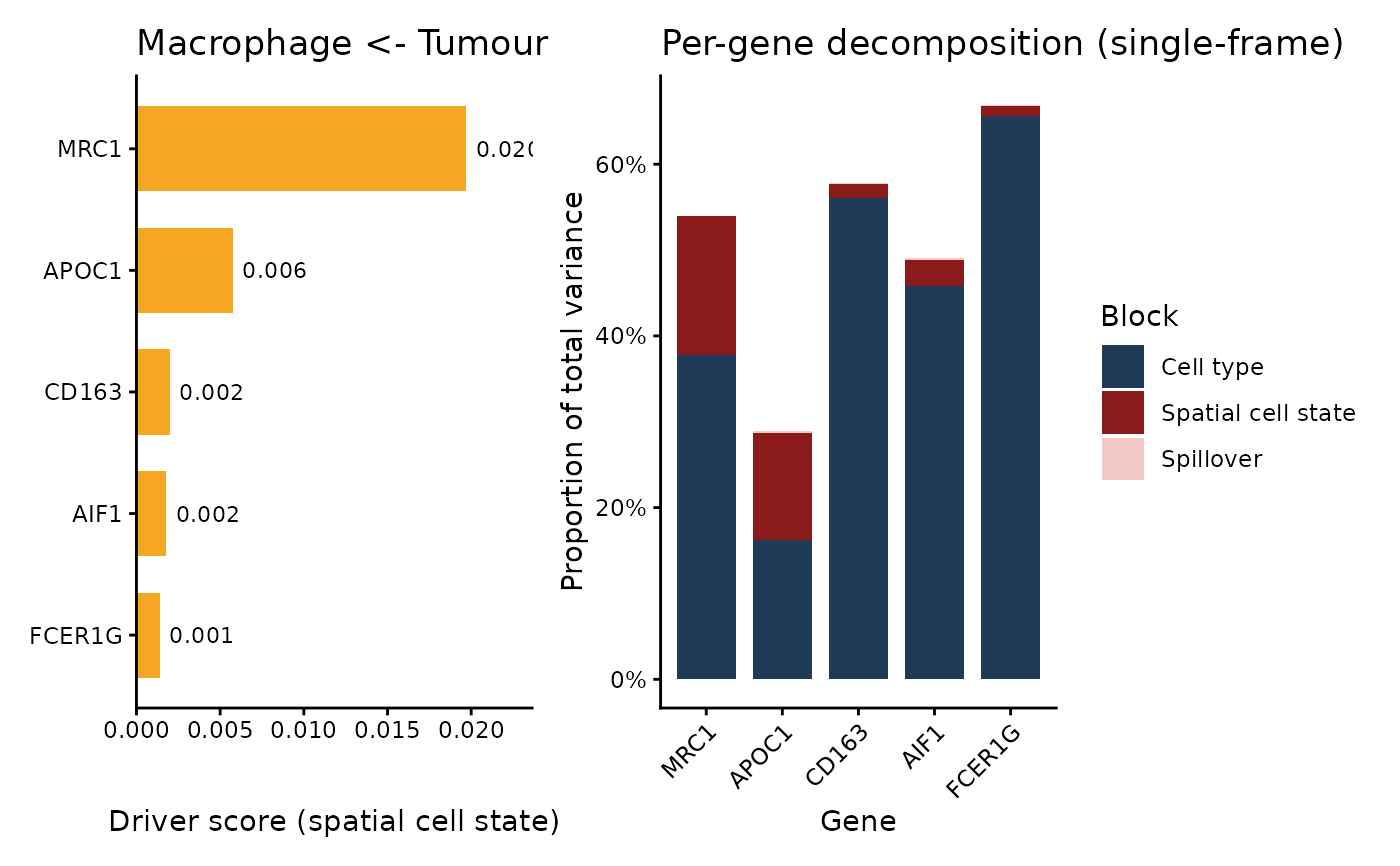
Reproduces the manuscript per-pair driver figure: the top genes ranked by
their driver score for a focal-neighbour pair, alongside their per-gene
single-frame variance decomposition. The score is carried in the
driver_score column of topDrivers(object).
Usage
plotDrivers(
  object,
  focal,
  neighbour,
  n_top = 5,
  panels = c("both", "score", "gene")
)
Arguments
- object
A PACEFit.
- focal, neighbour
The focal and neighbour cell types.
- n_top
Number of top genes to show.
- panels
One of
"both","score", or"gene".
Examples
fit <- readRDS(system.file("extdata", "pace_fit_example.rds", package = "PACE"))
plotDrivers(fit, "Macrophage", "Tumour")