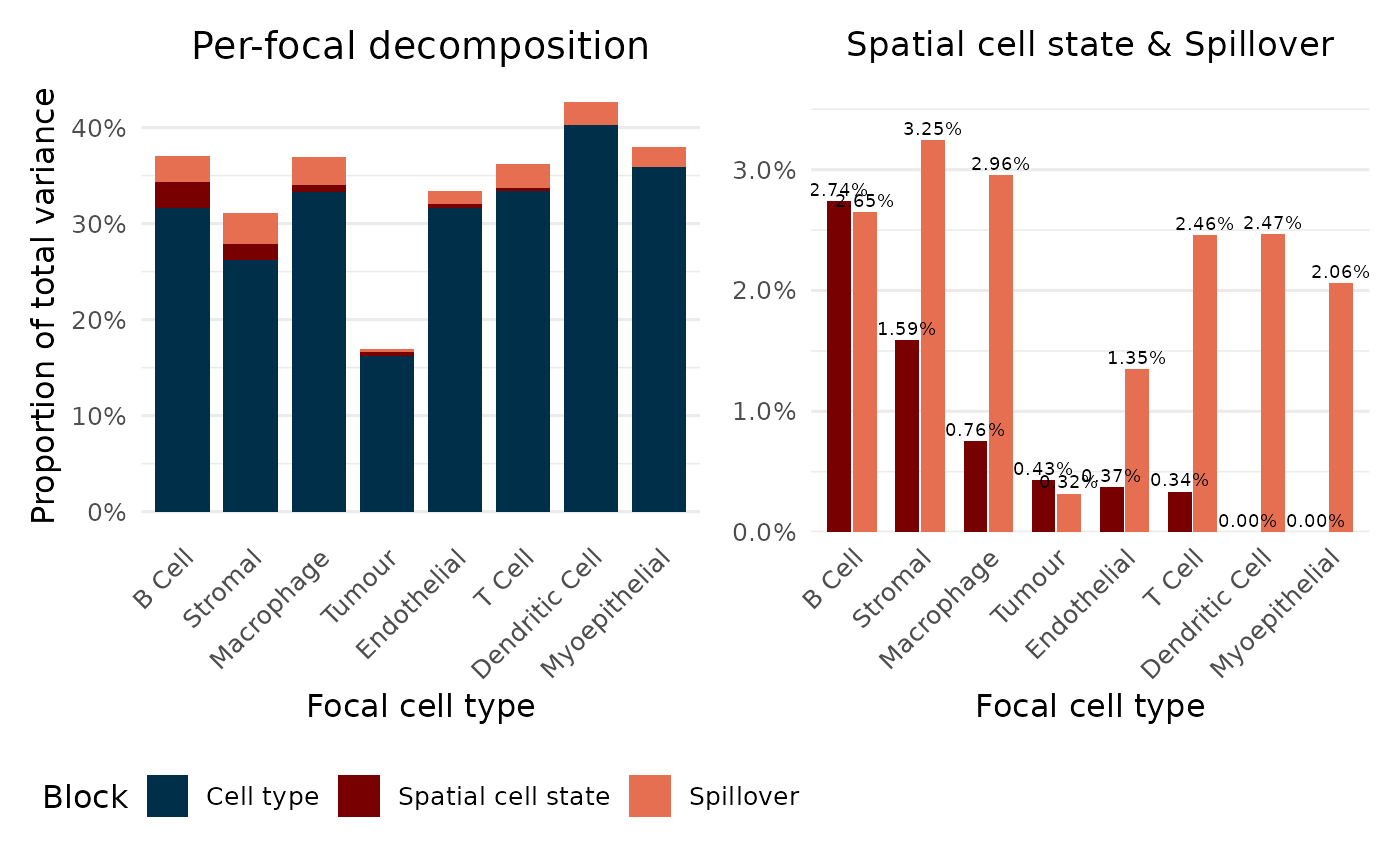
Reproduces the manuscript per-focal decomposition figure: a full stacked bar of the cell-type identity, spatial cell state, and contamination (spillover) components, with a zoomed grouped bar of the two small spatial components.
Arguments
- object
A PACEFit.
- title
Plot title.
Examples
fit <- readRDS(system.file("extdata", "pace_fit_example.rds", package = "PACE"))
plotDecomposition(fit)