A worked example#
The breast cancer Xenium section the package is tested against: 7,898 cells,
278 genes, eight cell types, centred on a tumour–macrophage interface.
examples/demo.py in the repository runs all of this.
Fitting#
import pace

fit = pace.pace_fit(adata, cell_type="cell_type")
One call fits the model, shrinks the slopes, decomposes the variance and ranks each pair’s drivers. On this section it converges in thirteen iterations.
What changes near tumour#
pace.top_drivers(fit, "Macrophage", "Tumour").to_dataframe().head()
 rank   gene  driver_score  b_clean   spec   lfsr
    1   MRC1        0.0197  -0.1495 0.9358 0.0000
    2  APOC1        0.0057   0.1302 0.8122 0.0000
    3  CD163        0.0020  -0.0391 0.9474 0.0365
    4   AIF1        0.0018  -0.0543 0.8077 0.0033
    5 FCER1G        0.0014   0.0331 0.8220 0.0156
Macrophages near tumour lose MRC1 and gain APOC1: the tissue-resident marker falling and the lipid-associated, immunosuppressive one rising. The contamination term has already absorbed the tumour transcripts bleeding into those macrophages, so these are macrophage genes changing rather than tumour genes leaking across the segmentation boundary.
The raw counts agree, with no model involved — binned by how many tumour cells sit within 30 µm, MRC1 falls from 1.3 to 0.5 while APOC1 climbs from 0.2 to 1.7.
Where the variance goes#
pace.variance_decomposition(fit).by_focal()
         focal  Cell type %  Spatial %  Spillover %  Residual %
        B_Cell        31.64       2.74         2.65       62.98
Dendritic_Cell        40.23       0.00         2.47       57.31
   Endothelial        31.65       0.37         1.35       66.62
    Macrophage        33.24       0.76         2.96       63.04
       Stromal        26.25       1.59         3.25       68.92
        T_Cell        33.37       0.34         2.46       63.83
        Tumour        16.16       0.43         0.32       83.09
Spatial effects are small next to cell-type identity, which is the usual and correct picture: what a cell is explains far more of its expression than where it sits. The question PACE answers is which genes make up that small share.
Which neighbours matter#
pace.pair_variance(fit)
The strongest pair on this section is B cells beside T cells, at 2.73% of the B cells’ variance. Tumour as a neighbour reaches more focal types than any other.
Figures#
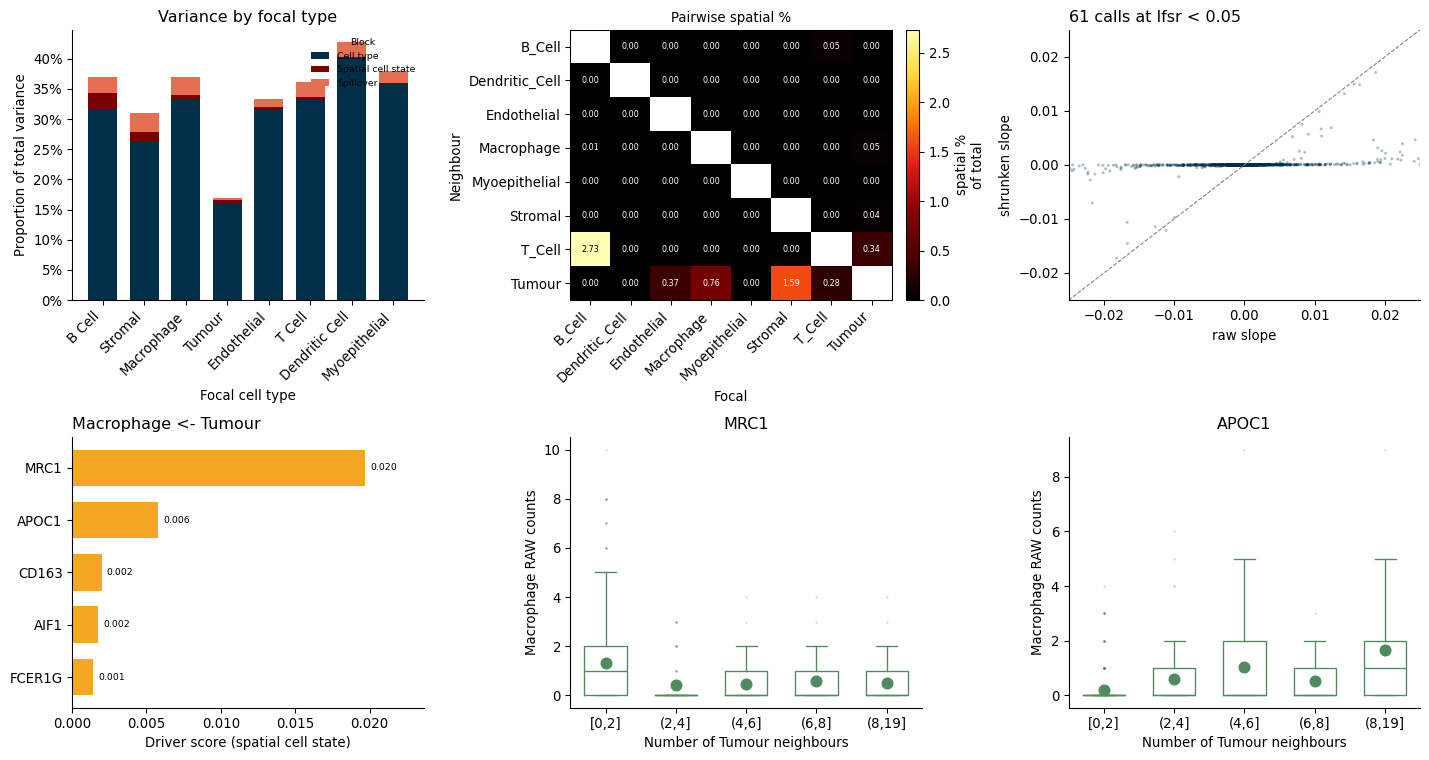
pace.plot_decomposition(frame)
pace.plot_pair_heatmap(pairs, fit.cell_types)
pace.plot_drivers(drivers, "Macrophage", "Tumour", single_frame=frame)
pace.plot_proximity(fit, counts, ["MRC1", "APOC1"], "Macrophage", "Tumour")
pace.plot_shrinkage(slopes)