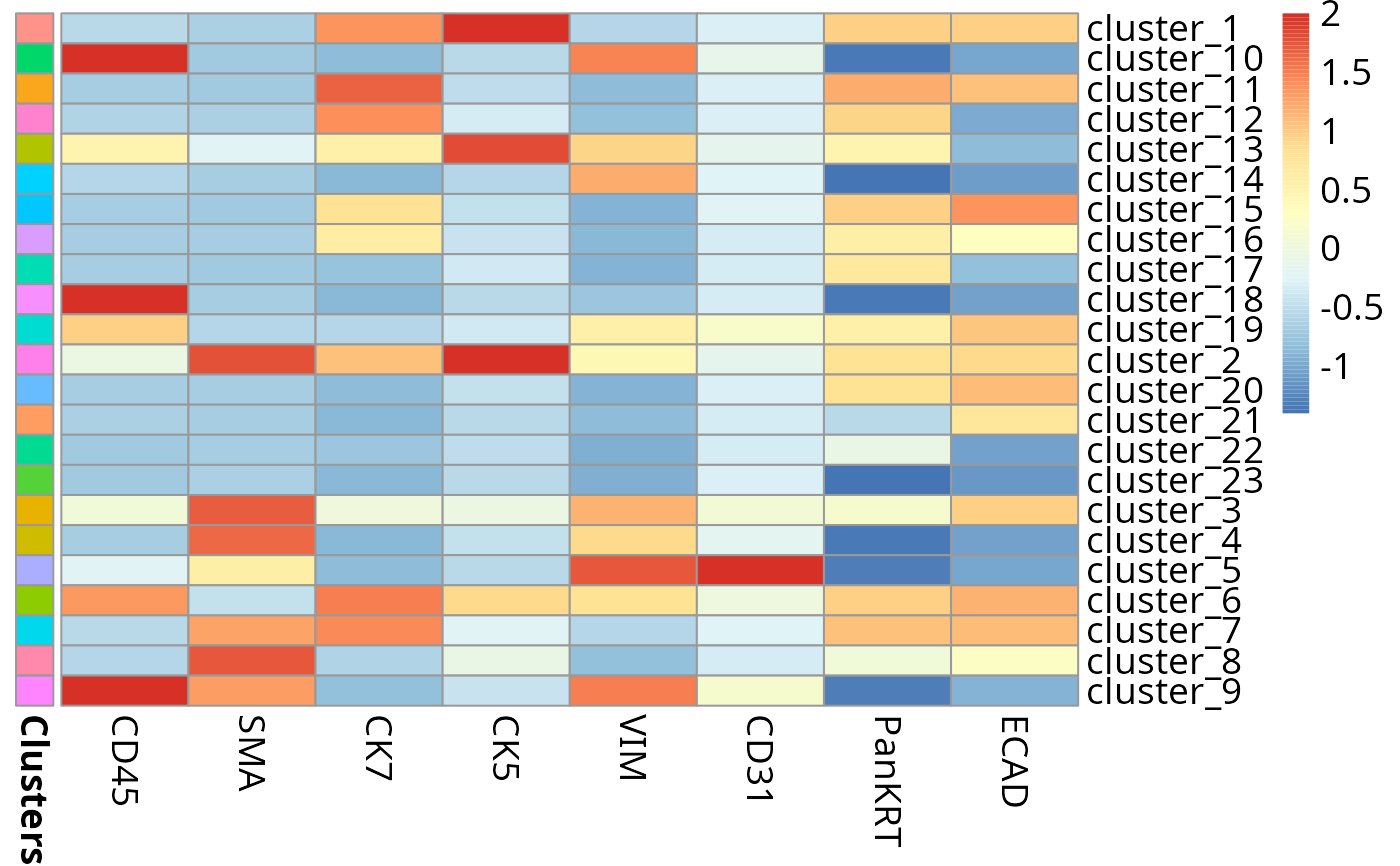
A function for generating a heat map of marker expression across clusters
Usage
markerHeatmap(
  data,
  markers = NULL,
  clusters = NULL,
  threshold = 2,
  clusterMarkers = FALSE,
  fontSize = 14
)
Arguments
- data
a matrix or dataframe where the rows are samples and columns are markers
- markers
a list of markers of interest. If not provided, all columns will be used
- clusters
a vector of cluster labels
- threshold
the value to threshold the marker expression at
- clusterMarkers
should the rows(markers) of the heatmap be clustered
- fontSize
the size of the text on the heatmap
Author
Elijah WIllie ewil3501@uni.sydney.edu.au
Examples
data("risom_dat")
risomMarkers <- c(
  "CD45", "SMA", "CK7", "CK5", "VIM", "CD31", "PanKRT", "ECAD"
)
res <- runFuseSOM(risom_dat, markers = risomMarkers, numClusters = 23)
#> You have provided a dataset of class data.frame
#> Everything looks good. Now running the FuseSOM algorithm
#> Now Generating the Self Organizing Map Grid
#> Optimal Grid Size is: 5
#> Now Running the Self Organizing Map Model
#> Now Clustering the Prototypes
#> Now Mapping Clusters to the Original Data
#> The Prototypes have been Clustered and Mapped Successfully
#> The FuseSOM algorithm has completed successfully
p.heat <- markerHeatmap(risom_dat, risomMarkers, clusters = res$clusters)